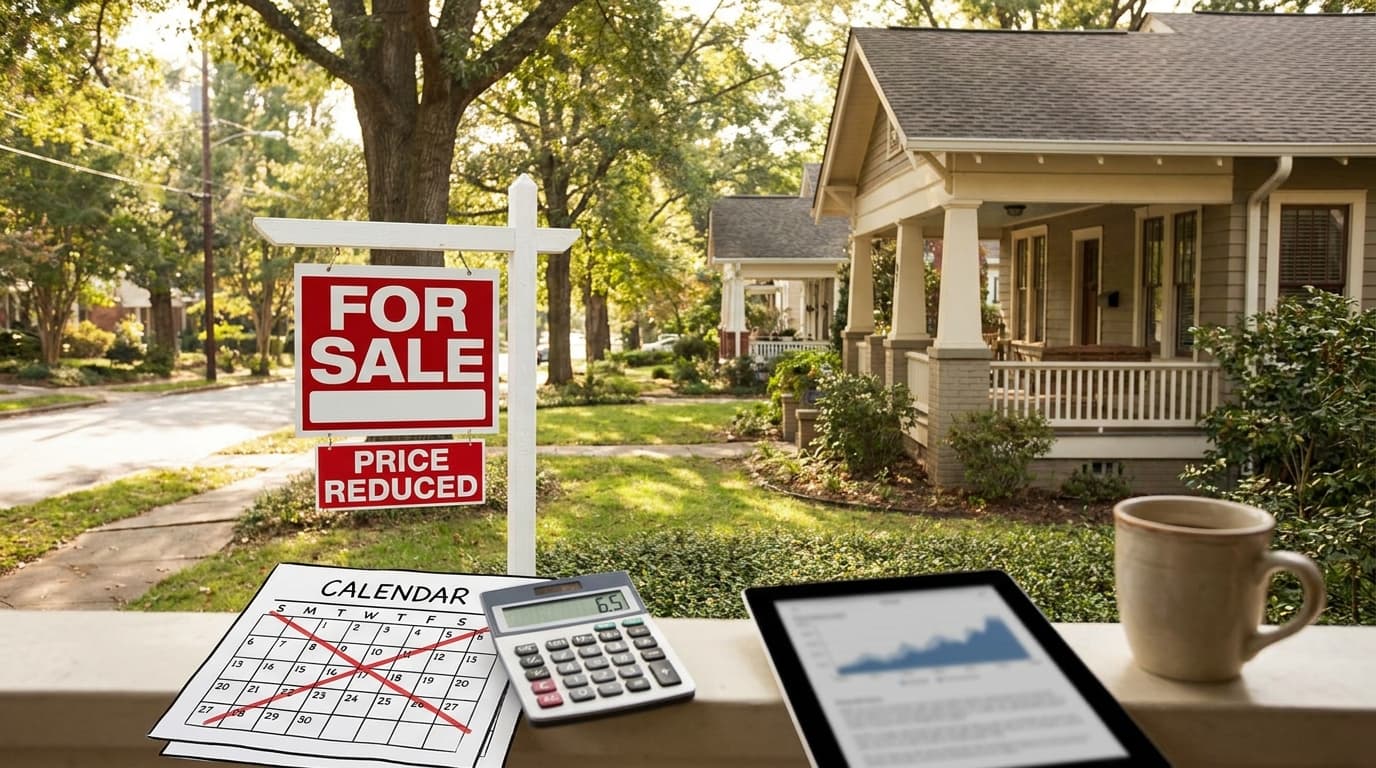
For three years, metro Atlanta sellers held the upper hand. Multiple offers, waived contingencies, and homes going under contract in a weekend were the norm. Heading into the spring and summer of 2026, that script has flipped. A large share of listings across the metro are now cutting their asking price rather than fielding bidding wars — and the data suggests this is a durable shift in negotiating power, not a one-month blip.
Local brokerage and Georgia MLS-based market data put the share of metro Atlanta sellers who had reduced their asking price at roughly 40% as of spring 2026. That tracks with — and runs a bit ahead of — the national picture: Redfin reported that 35.4% of U.S. sellers cut prices in April 2026, down slightly from a record 36.6% in August 2025. In plain terms, somewhere around one in three listings nationally, and closer to two in five locally, has had to drop its number to find a buyer.
The data: more homes, slower sales, thinner premiums
The clearest driver is supply. Metro Atlanta had roughly 20,998 active listings in May 2026, according to local market data, after the count peaked near 25,700 in late 2025. Inventory has now climbed for a third consecutive year, giving buyers far more to compare than they had during the peak-competition years. FRED's active-listing series for the Atlanta-Sandy Springs-Roswell metro documents that same multi-year rebuild.
That inventory works out to about 2.1 months of supply as of May 2026, with core counties reporting double-digit year-over-year increases in available homes. It's worth keeping that number in perspective: a fully balanced market is generally considered to be around five to six months of supply. At 2.1 months, Atlanta is still technically tighter than "balanced" — which is exactly why this looks like softer list prices and more negotiating room rather than a collapse in values.
The slowdown shows up in the pace and price of sales, too. Redfin data puts median days on market around 55 days, and the sale-to-list price ratio has eased to roughly 98.65%. After years of homes selling at or above asking, sellers are now generally netting just under their list price — a small change on paper that signals a real shift in leverage toward buyers.
Why now: rate gravity and the lock-in effect
The reason demand stays muted while supply rises comes down to mortgage rates. The Freddie Mac 30-year fixed averaged about 6.47% in mid-June 2026 (6.52% a week earlier) and has oscillated in roughly the 6.4% to 6.6% range since February 2026.
That matters in two directions. For buyers, a rate near 6.5% constrains how much house a monthly budget can cover, which cools demand. For existing owners, it creates what's often called the lock-in effect: most current homeowners financed or refinanced into sub-4% mortgages during the low-rate years, and trading that for a 6.5% loan is a hard sell. So they stay put. The result is a market where supply keeps building, demand stays soft, and sellers who do list have to compete harder on price.
An important nuance: a correction, not a crash
It's easy to read "40% of sellers cutting prices" as falling home values everywhere. The data doesn't support that framing, and it's worth being precise.
Softer list prices and more negotiating room are not the same thing as a broad drop in home values. On the value side, the two major trackers actually diverge: Redfin shows the metro Atlanta median sale price near $435,000, roughly flat year-over-year, while Zillow's typical home value (around $380,000) is down about 2.3% over the same period. Median list prices run lower still, around $365,000. The takeaway is that prices are roughly flat to modestly down depending on the measure — a correction in pricing dynamics, not a uniform decline in what homes are worth.
Where it's hitting hardest
The pressure isn't spread evenly. Townhomes and condos are absorbing the sharpest oversupply, with longer days on market and deeper price cuts than single-family homes. Buyers shopping those segments will likely find the most room to negotiate; sellers in them face the toughest pricing decisions.
The new-construction wildcard
Resale sellers aren't only competing with each other. National homebuilders are spending aggressively to move inventory, and their main tool is the mortgage-rate buydown. D.R. Horton has leaned into buydowns advertised around 3.99%, with roughly 73% of its Q4-2025 buyers receiving some form of buydown. Lennar averaged about $54,947 per home in incentives in Q2 2026 — close to 12.9% of the sale price.
A builder offering a near-4% rate is a powerful draw when the going market rate is 6.5%, and it pulls some buyers toward new homes and away from resale listings. That competition reinforces the price-cut pressure on existing-home sellers. Industry outlooks reflect the strain on builders themselves, too, with a meaningful share cutting prices on their own inventory.
For buyers, the buydown math deserves a careful look rather than a reflexive yes. A subsidized rate lowers the monthly payment, but analysts caution that incentive-heavy new-home purchases can leave buyers close to underwater if the as-built price already bakes in the incentive. Compare the all-in cost — price, rate, and how long the buydown lasts — against a comparable resale home where you might negotiate the price down directly.
What it means for buyers
This is the most negotiating room Atlanta buyers have had in years. More listings, longer days on market, and a sub-99% sale-to-list ratio all point to leverage you didn't have in 2021 or 2022. A few practical cautions:
-
Watch for stale, overpriced relistings. Some homes lingering on the market are there because they were priced too high to begin with, not because they're a bargain. A long days-on-market figure can be an opening to negotiate — or a warning sign.
-
Run the builder-buydown numbers carefully. A 3.99% advertised rate is attractive, but weigh the full price and incentive structure against negotiating on a resale home.
-
Condos and townhomes carry the most softness. That can mean opportunity, but also more competition to resell later.
What it means for sellers
The single biggest change is that pricing correctly in the first week now matters far more than it did during the bidding-war era. With more competition on the market, an overpriced listing tends to sit, then trigger a price-cut cycle that signals weakness to buyers — the opposite of the multiple-offer dynamic of 2021 and 2022. Pricing to the current market from day one is now the strategy that protects your net.
Outlook
The broader signals point in the same direction. Zillow ranked Atlanta the second-most buyer-friendly major U.S. market for 2026, citing rising days-on-market, a high share of listings with price cuts, and relatively manageable affordability — a typical payment running around 30.5% of median income, versus 46.7% in Miami.
None of this guarantees where prices go next. Inventory is rebuilding but still below a fully balanced level, rates remain the dominant variable, and the new-construction incentive war is an active force. The honest summary for the rest of 2026: more room to negotiate and a genuine shift toward buyers, set against home values that are roughly flat rather than falling off a cliff. Buyers should press their advantage while staying disciplined; sellers should price to reality from the start.
Related reading
-
[Georgia's New 'Floating' Homestead Cap (HB 581) Hits Its First Full Tax Year — Why Some Counties Opted Out and What It Means for Your Escrow](/article/georgia-hb-581-floating-homestead-cap-2026-opt-out-escrow)
Sources
-
Redfin — Price Drops Are Becoming Slightly Less Common As Housing Market Stabilizes (April 2026)
-
BHHS Georgia Properties — Metro Atlanta Market Update: Supply, Affordability & Predictions for 2026
-
FRED (St. Louis Fed) — Housing Inventory: Active Listing Count, Atlanta-Sandy Springs-Roswell, GA
-
Urbanize Atlanta — Zillow pegs Atlanta second-most 'buyer-friendly' U.S. market of 2026
-
National Mortgage News — 2026 homebuilder outlook shifts to 'deteriorating': Fitch
This article contains AI-assisted content and has been reviewed in our publication workflow.